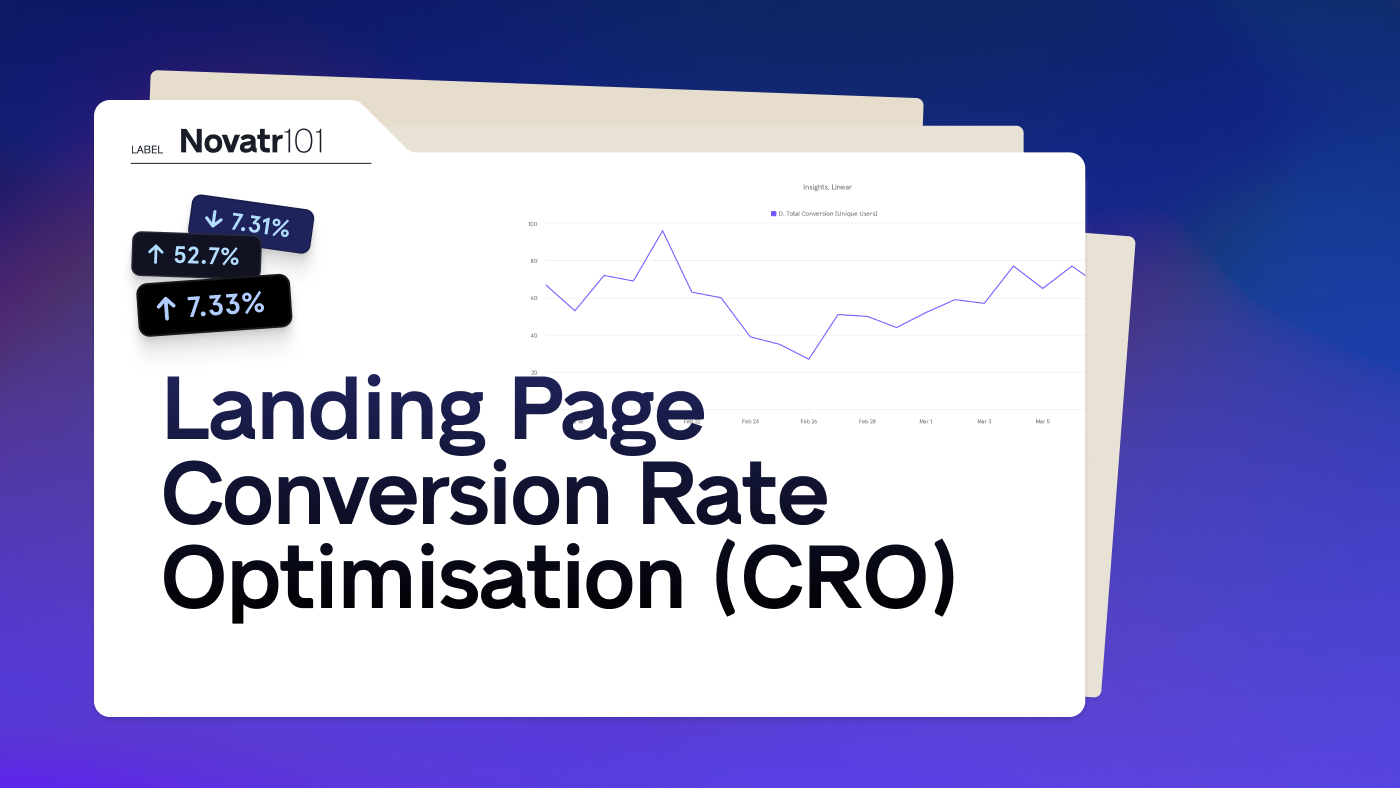
The situation
Novatr was growing fast. New courses, new audiences, new landing pages, and new campaigns were launching every few weeks. On the surface, everything looked healthy — traffic was strong, leads were flowing, the business was scaling. But underneath that momentum, something felt off.
Our flagship BIM Professional Course for Architects — the single biggest driver of revenue — was built with care. The content was solid, the value proposition was clear, and the audience was highly intent-driven. Yet the pattern was consistent: traffic remained healthy, but conversions repeatedly fell short of expectations.
Where the certainty broke down
Every conversation about the page ended the same way. Marketing advocated for stronger copy. Sales pushed for shorter forms. Design tested new layouts. Engineering implemented without full alignment. Everyone had an opinion about the fix. No one had conviction — because no one could say with confidence where users were actually dropping off, or why.
The trigger to change how we worked wasn't a dramatic drop in numbers. It was decision fatigue. As the design lead on this, that lack of shared clarity concerned me more than any single conversion metric: when a team can't make decisions with confidence, momentum stalls, and in a growth-stage company that cost shows up quietly — in missed opportunities, not in a dashboard.
My approach
I reframed the brief for the team from "improve conversion" to "understand hesitation." We instrumented Mixpanel and Google Analytics — not as reporting tools, but as empathy tools: scroll depth, hero and section engagement, campaign source paths, and form-start patterns became a way to see how people actually behaved on the page when no one was watching. That reframe was the specific decision I made as design lead: the goal was never the dashboard. It was designing for confidence instead of designing for conversion.
What the data showed
Once we tracked real behavior, the gap became obvious. A large share of visitors read deep into the page — engaging with curriculum highlights, real-world project simulations, and mentorship benefits — and then paused before starting the form. They were interested. Something in the final stretch was costing us their confidence, not their attention.
The more useful signal was directional rather than absolute: in the periods we tracked, traffic and conversion didn't move together. There were stretches where traffic dipped slightly and conversion went up meaningfully — the opposite of what a traffic-first mindset would predict.
Traffic vs. conversion, indexed
Illustrative reconstruction of the pattern observed on the BIM course page
View underlying data
| Period | Traffic (indexed) | Conversion rate (indexed) |
|---|---|---|
| M1 | 100 | 100 |
| M2 | 104 | 108 |
| M3 | 98 | 118 |
| M4 | 92 | 132 |
| M5 | 95 | 145 |
| M6 | 90 | 158 |
| M7 | 93 | 167 |
| M8 | 91 | 176 |
Note on this chart: this is an illustrative reconstruction built for this portfolio, using indexed values rather than the original Mixpanel/GA dashboard data (which I no longer have access to). The directional pattern — traffic drifting down slightly while conversion rose — reflects what was actually observed on the BIM course page during this project.
What we changed
We redesigned the page around that emotional reality rather than around a layout guess. We reduced perceived commitment before the form, moved proof — outcomes, credibility signals, real student results — closer to the decision point, and clarified what someone would get before asking them for effort. We also changed what we measured: the team's shared target metric shifted from "conversion" to "form starts," since that's where the hesitation was concentrated and where a design change could actually move something.
Outcome
Form-start rates and conversion both improved, and traffic quality became more consistent across campaigns. But the change that mattered more to me as a design leader happened across teams, not just on the page: conversations became less defensive and more reflective, marketing and design started using a shared insight language, engineering began instrumenting for real behavior signals instead of vanity metrics, and sales reported better lead quality because the users who started forms now did so with clearer intent.
CRO stopped being treated as "a performance marketing task" handed to whichever team was under the most pressure that quarter. It became an operating rhythm — a shared feedback loop across design, marketing, sales, and engineering that outlasted this one page and became how we approached every page after it.
Reflection
This project cemented something I still lead with: data doesn't replace intuition, it preserves it. It doesn't end debates, it ends guesswork. With a shared source of truth, teams move faster and with more conviction — and when that becomes a habit rather than a one-off initiative, growth stops being accidental.
If I were running this today, I'd change one thing about the sequencing: I'd build the measurement framework into every new landing page from day one, rather than retrofitting it onto our highest-stakes page after the fact. The instinct to treat analytics as an empathy tool, not a report, is the part I'd install first at any future company — before the first pixel gets designed.